Rainfall level graph
The graph shows recent rainfall levels compared with the long-term average. Click or hover over the graph to see the figures.
Help and resources
Useful Commercial links
Useful Region Links


Useful Commercial links


View the latest monthly rainfall figures across our region compared with the long-term average.

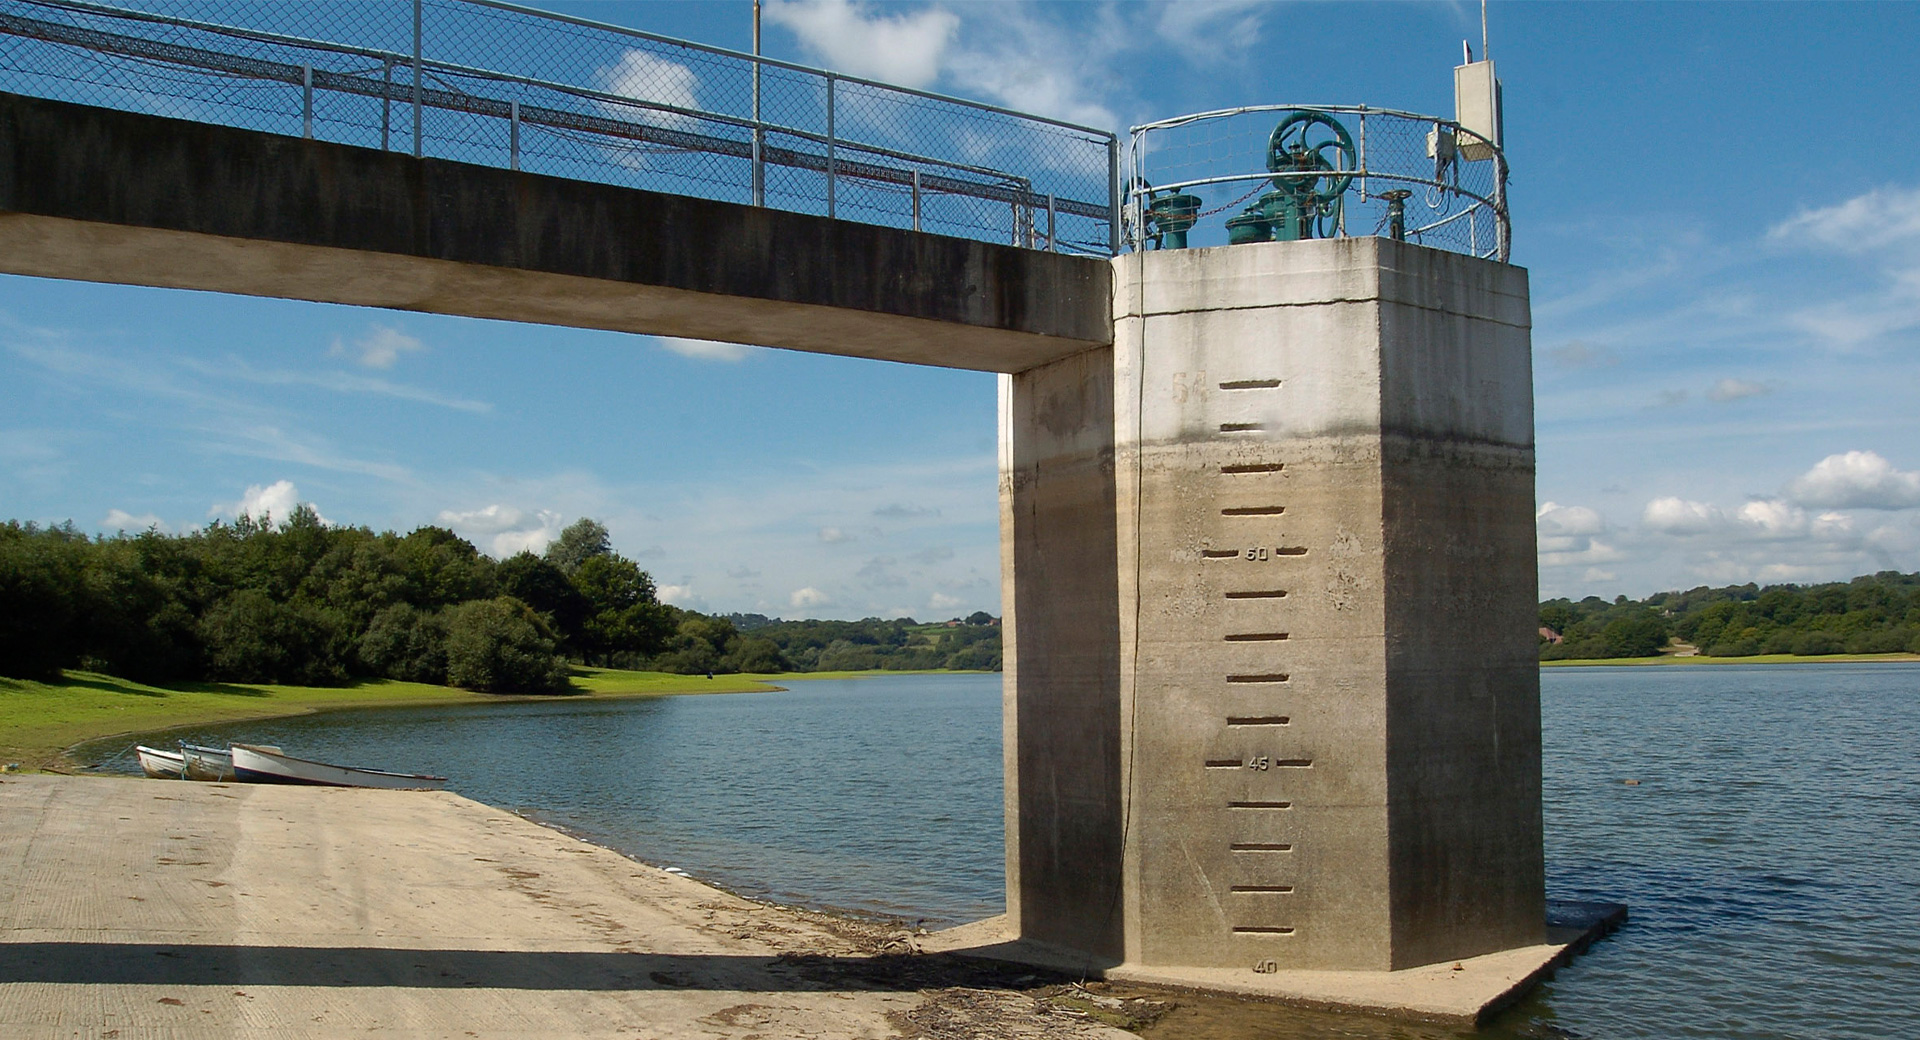
Rainfall levels have an impact on water supply. Enough rainfall during wetter months replenishes rivers, reservoirs and aquifers for use in dryer months. However, exceptionally high levels of rainfall, especially over a short period of time, can cause flooding and increases the volume of wastewater that needs to be managed. This can overwhelm our system and result in storm overflows.
At the other end of the scale, too little rainfall can lead to droughts and shortages of water supply. Together, we can do our bit to save water and make sure there is enough to go around when rainfall levels drop across our region.

The table shows the long-term average of monthly rainfall compared to the actual monthly rainfall.
| Month | Long-term average | Actual rainfall |
|---|---|---|
| November 2024 | 96.06mm | 81.27mm |
| December 2024 | 89.06mm | 63.81mm |
| January 2025 | 84.02mm | 115.01mm |
| February 2025 | 79.01mm | 61.07mm |
| March 2025 | 54.07mm | 7.08mm |
| April 2025 | 56.19mm | 26.06mm |
| May 2025 | 52.04mm | 21.95mm |
| June 2025 | 52.77mm | 34.58mm |
| July 2025 | 50.35mm | 64.93mm |
| August 2025 | 49.52mm | 33.16mm |
| September 2025 | 56.04mm | 87.83mm |
| October 2025 | 62.21mm | 105.33mm |
| November 2025 | 96.06mm | 85.05mm |
| December 2025 | 89.06mm | 99.11mm |